Demand Curve
Demand Curve Assignment Help | Demand Curve Homework Help
The Demand Curve
The demand curve shows what quantities of a good buyers are willing to buy at different prices. Note the expression “are willing.” It is not about how much they actually buy, but about how much they would want to buy if a certain price was offered.A demand curve is only valid if all other relevant factors are held constant (ceteris paribus: with other things the same). The most important other factors that can affect demand are:
1- The buyers’ income.
2- Prices and price changes on other goods. We will make a distinction between complementary goods and substitute goods. An example of complementary goods is right and left shoes. If the price of right shoes rises then the demand for right shoes will typically decrease. However, the demand for left shoes will also typically decrease. Consequently, the demand for left shoes partly depends on the price of another good: right shoes. Substitute goods work in the opposite way. An example could be blue and green pens: If one cannot use blue, one can often use green instead. If the price of green pens rises, the demand for green pens typically decreases. However, if the price of blue pens is unchanged one can use these instead of the green ones, and then the demand for blue pens increases. Consequently, the demand for blue pens depends on the price of another good: green pens. Note that for substitute goods, a rise in the price of the other good leads to an increase in the demand for the good we are analyzing, whereas for complementary goods it is the other way around; a rise in the price of the other good leads to a decrease in the demand for the good analyzed.
3- Preferences. What consumers demand is largely a matter of taste. If there is a change in taste, there is usually also a change in demand. Taste can change for many different, underlying, reasons. For example, changes in moral perception or in fashion. If these factors are held constant, then the demand curve is valid and it usually slopes downwards. In other words, the lower the price is the higher is the demand, and vice versa. Demand is defined for a certain period. One can for example think of it as defined over a month, corresponding to a monthly salary. When drawing a demand curve in a diagram, the quantity demanded is on the X-axis and the price is on the Y-axis. This is slightly odd, since we often think of the quantity demanded as a function of the price, not the other way around. There are historical reasons for drawing it this way.
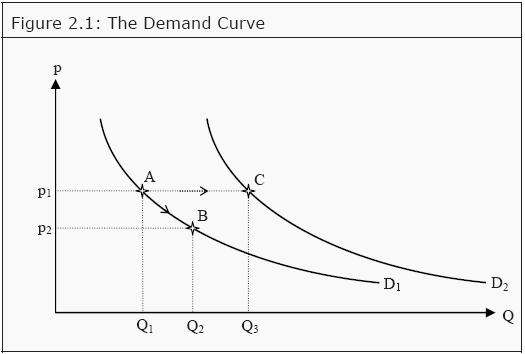
The relation between price and quantity that is described by the demand curve is valid only if it is the price of the good itself that changes. Look at Figure 2.1 and the demand curve D1. If, in the beginning, the price is p1, then the quantity demanded is Q1 (point A). If the price of the good falls to p2, then the quantity demanded changes to Q2 (point B). We, consequently, move along the demand curve when the price of the good changes.

If, instead, something else changes (e.g. income, the prices of other goods, consumer preferences, or anything that affects the demand on the good), then the demand curve shifts. Assume again that the price is p1 so that the quantity demanded is Q1 (point A). If the consumer’s income increases, she can buy more of the good than she could before. Consequently, the whole demand curve shifts from D1 to D2. If the price is still p1, the quantity demanded increases to Q3 (point C).