Indifference Curves
Indifference Curves Assignment Help | Indifference Curves Homework Help
Indifference Curves
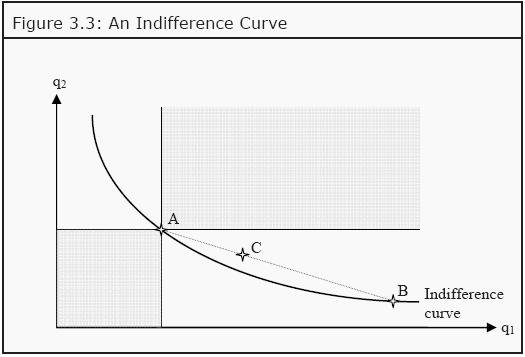
If we only have two goods, we can illustrate different baskets that the individual if indifferent between with indifference curves. All points on an indifference curve are baskets that the individual perceives are equally good. She is, in other words, indifferent between them. An example of a typical indifference curve is shown in Figure 3.3.
After having made the four assumptions above, we can say a lot about what an indifference curve must look like. All points in the diagram (i.e. all possible combinations of good 1 and 2) correspond to a basket. Since the preferences are complete, there must be some preference curve that runs through any point in the diagram. Another way to say the same thing: Pick any point in the diagram; whichever point you picked, there is an indifference curve running through that point. We now randomly select a point in the diagram, say point A. Since the individual is non-satiable, all points where she gets more of either good 1, or good 2, or of both are better for her. This corresponds to the grey area northeast of point A. Similarly, all points where she gets less, the grey area southwest to A, must be worse for her. Consequently, she cannot be indifferent between basket A and any point in the grey areas. Therefore, a preference curve that runs through A cannot also run through any point in the two grey areas. This means that an indifference curve will slope downwards. (See, however, the case of complementary goods in Section 3.6)
The assumption of convexity implies that the slope will become smaller and smaller as we move to the right. Convexity means that, if we randomly choose any other point on the indifference curve that runs through A, say point B, and then choose a point in between them, say point C, then point C must be better than (or at least as good as) A and B. C must therefore lie on a higher indifference curve than the one that runs through A and B. If this is true for any choices of A, B, and C, then the curve must slope less and less the farther to the right we get.
An economic interpretation of this criterion is that, the less one has of a certain good, e.g. the lower q1 is, the less inclined one is to give up one more unit of that good. If that is so, then one will demand more of the other good to compensate for the loss of that one unit. We, consequently, have to increase q2 more and more, the lower q1 is, to ensure that the individual has the same utility. And as we need larger and larger amounts of good 2 to keep the individual indifferent after having lost one more unit of good 1, the slope of the indifference curve will increase as we move to the left (i.e. as we reduce good 1), and vice versa when we move to the right.