The Supply Curve
The Supply Curve Assignment Help | The Supply Curve Homework Help
The Supply Curve
The producer counterpart to the demand curve is the supply curve. It shows how large quantities the producers are willing to sell at different prices, given that other factors that can affects supply are held constant. The supply curve is typically upward sloping or horizontal (but it could also be downward sloping). The demand curve is also valid over a certain period. Later, we will distinguish between two time periods: short and long horizons.
The most important factors, beside the price, that affect supply are:
1- Factor prices, i.e. wages, prices of machines and compensation to
owners and lenders. In other words, changes in the cost of production.
2- Laws and regulations that apply to the production.
3- Prices of other goods the firm produces or could potentially produce. Perhaps the producer is producing blue and green pens. If the price of green pens rises, she is likely to shift over resources (workers and machines) to that production and there is less left with which to produce blue pens. Consequently, the supply of blue pens decreases, even though the price of blue pens is unchanged.

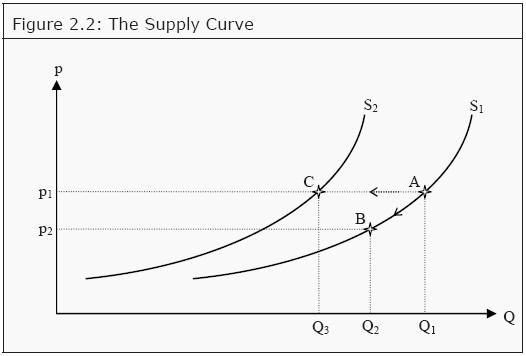
The supply curve behaves in a way that is similar to that of the demand curve. Look at Figure 2.2 and the supply curve S1. If the price is p1, then the producers are willing to sell the quantity Q1 (point A). If the price of the good falls to p2, we move along S1 to point B, where the quantity is Q2. If, instead, some other factor changes, e.g. if wages increase so that it becomes more expensive to produce the good, the whole supply curve shifts. For instance from S1 to S2. If the price is still p1, then the quantity supplied changes from Q1 to Q3 (point C).